
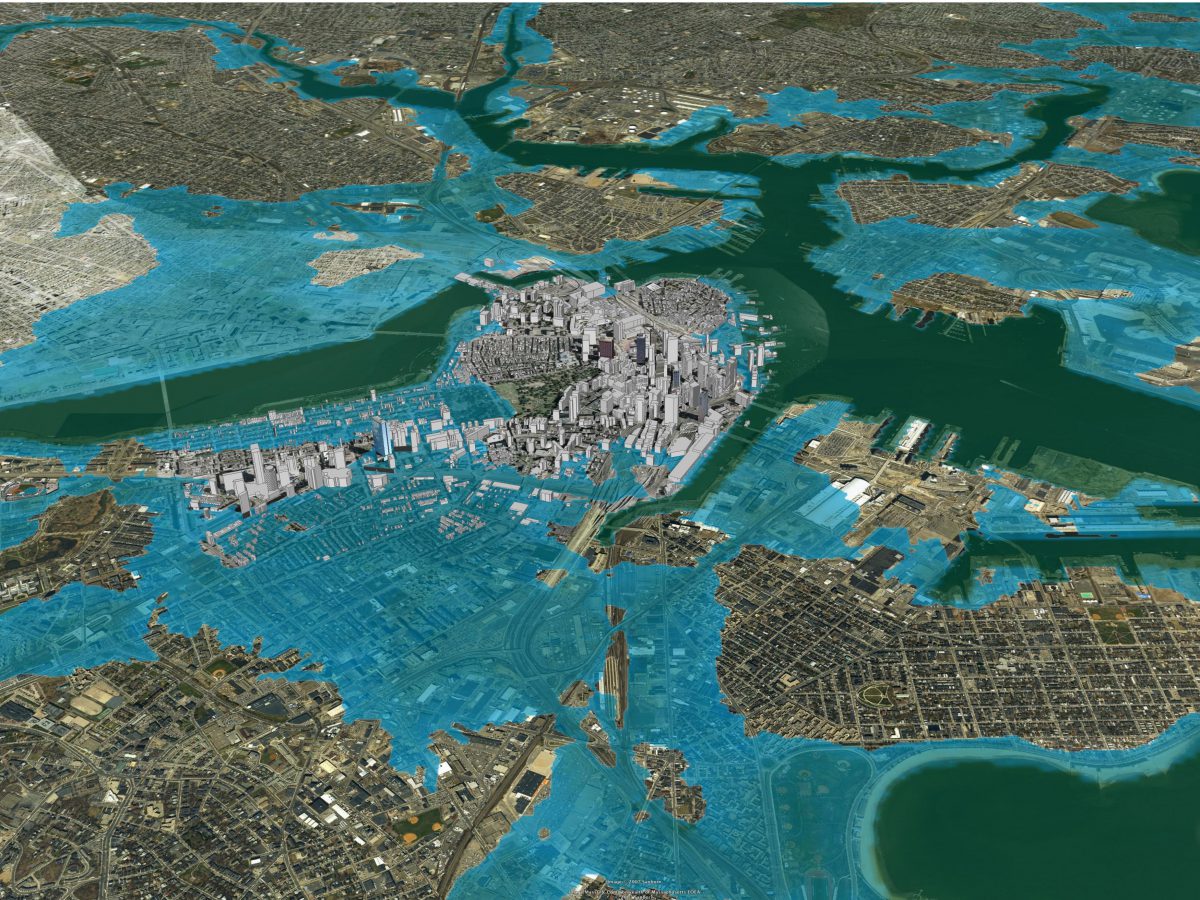
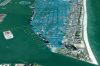
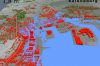
 3m Sea Level Rise, Boston
Architecture 2030
Boston, Massachusetts, United States
Credit: © 2007 2030, Inc. and © 2007 Google


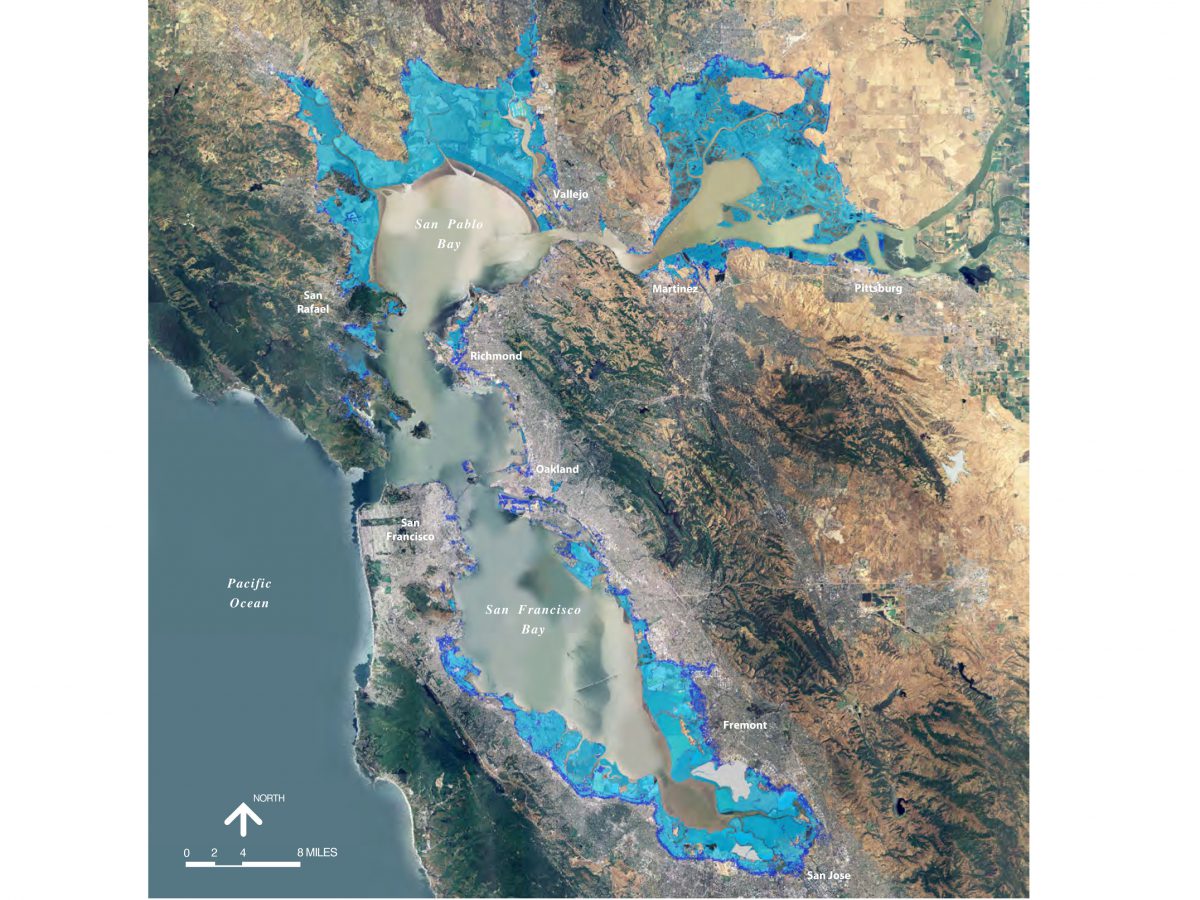


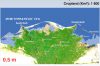
海平面上升和风暴潮地图创建了未来受到洪水威胁的社区资源和区域的详细情况。
海平面上升将淹没湿地和低洼地区,侵蚀海滩,破坏基础设施,导致人口流离失所,加剧洪水泛滥,并增加河流、海湾以及地下水的盐度。
为社区绘制海平面上升和风暴潮地图包含以下四个步骤:
- 获取并准备地形海拔高度数据。
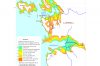
- 建立海水面和高水位的平均海拔高度。
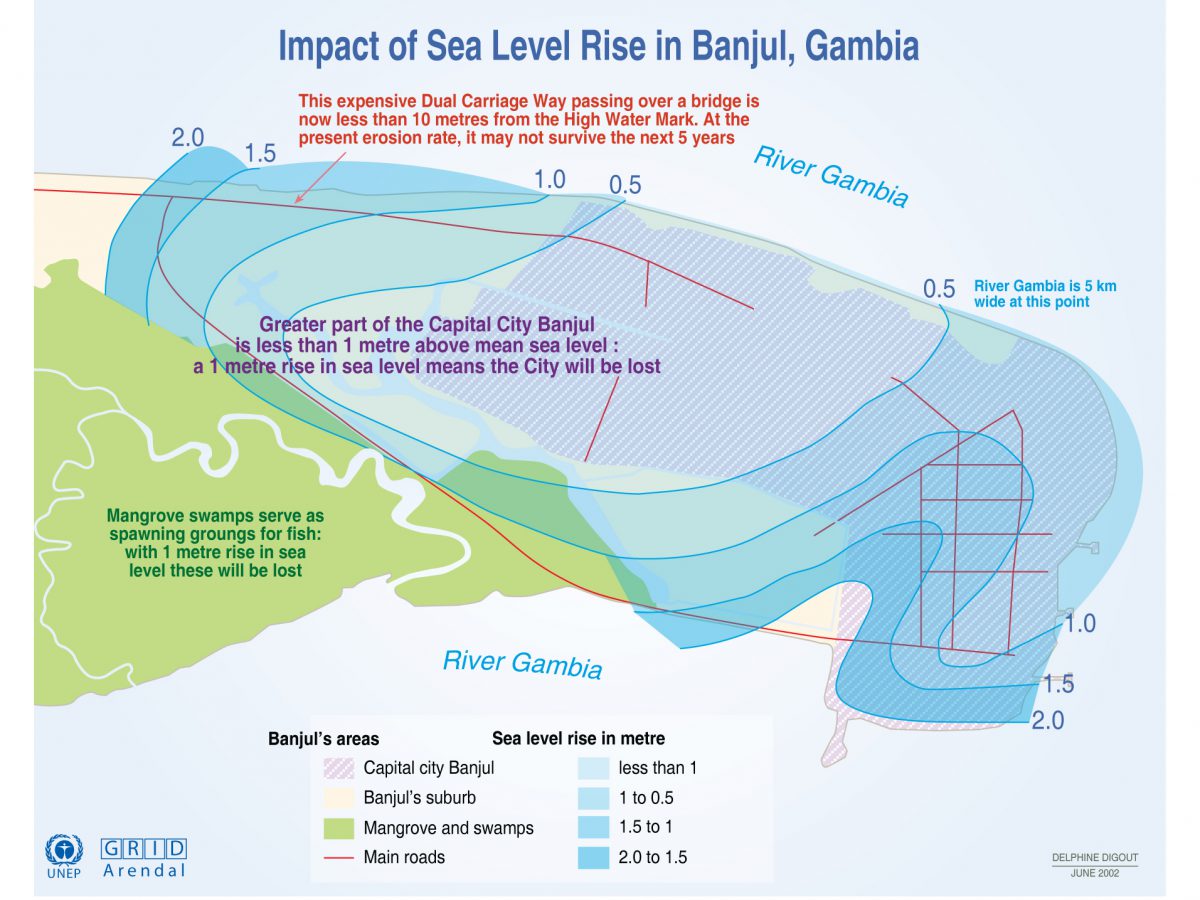
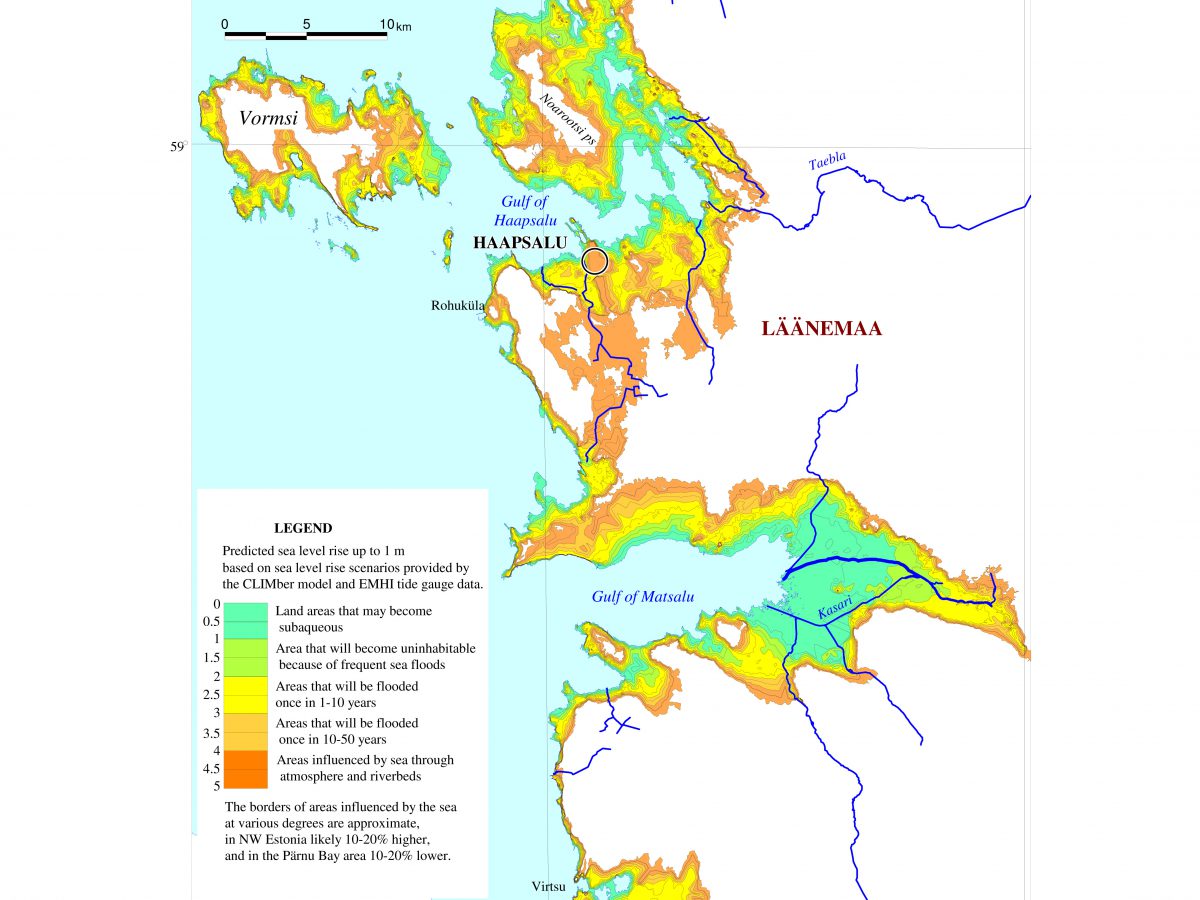
- 以海平面上升0.5〜2米( 1.5至6.5英尺)和风暴潮上涨1 〜3米( 3-10英尺)的递增量绘制洪水淹没图。
- 将洪水和风暴潮的情境预测可视化。


